Published on April 21st, 2021
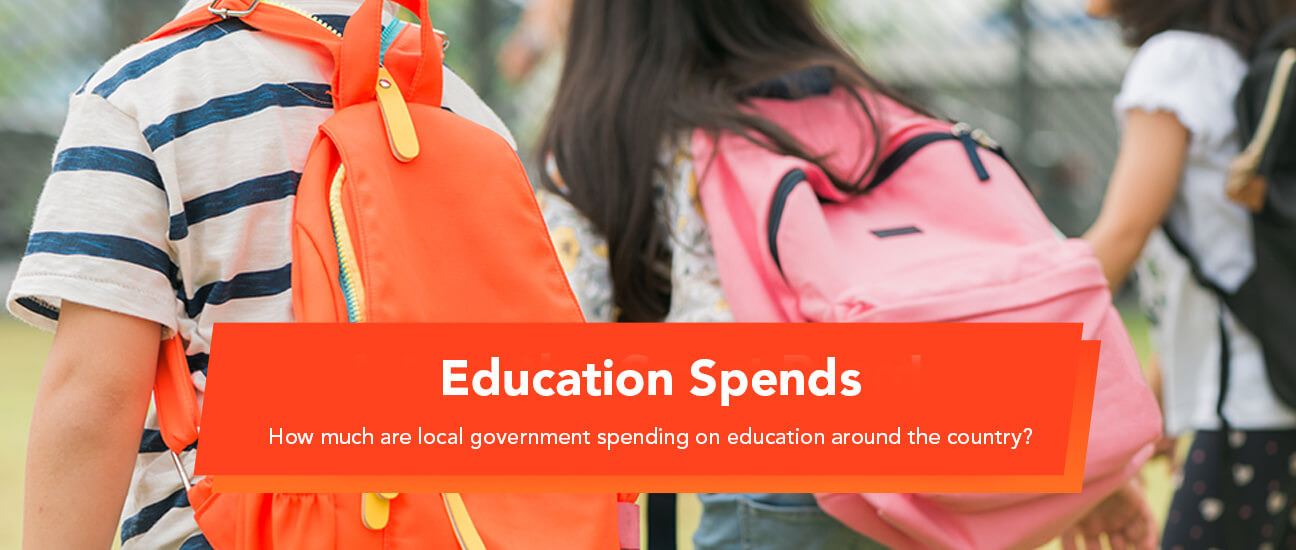
Education Spends
7 minute read
Education spending (of which EdTech such as Promethean interactive displays and teaching software is just one area) is one of the most important things that taxpayer money goes towards, from early years nurseries to post-16 education.
But with funding for schools being controlled by individual local authorities, which parts of the country are investing the most into the future of their youngsters?
We’ve analysed the latest government spending data to find out, as well as highlighting the areas where spending has increased and decreased the most in the last five years.
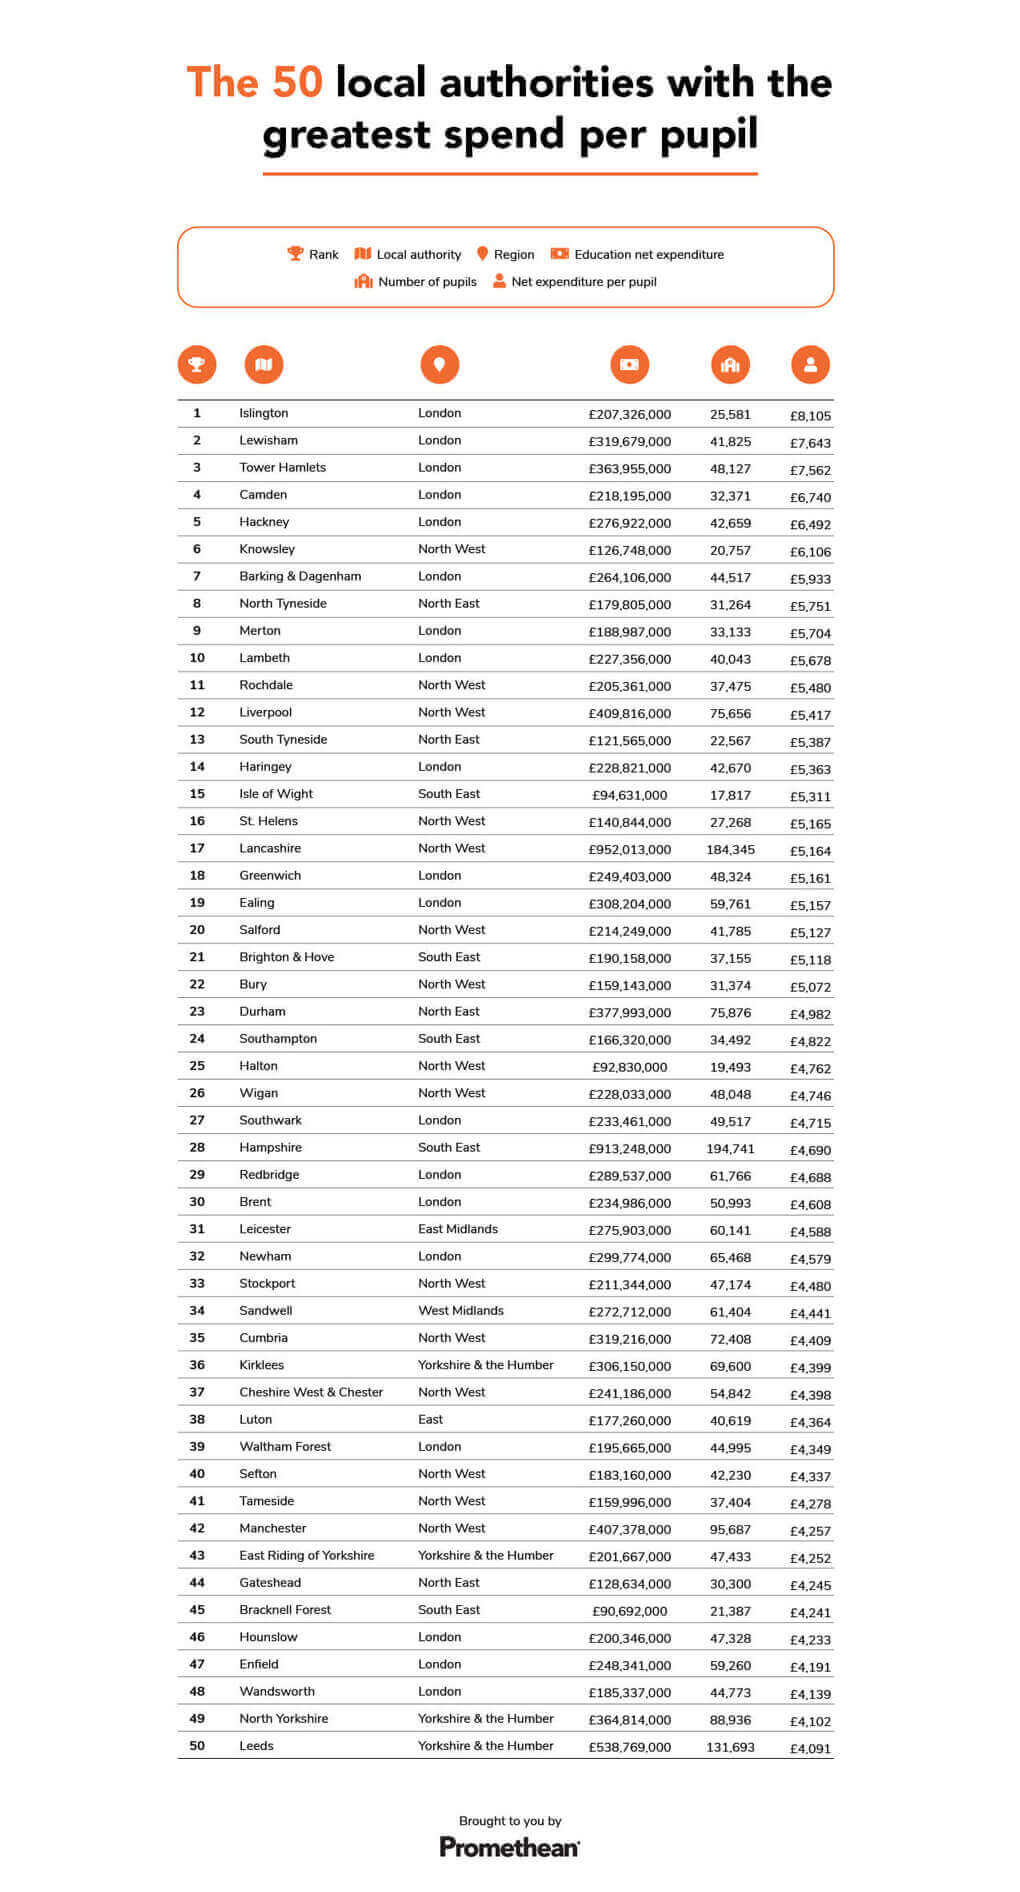
The areas spending the most per pupil
It’s clear that it’s pupils in London who enjoy the greatest funding in the country, with eight of the top ten highest-spending areas located in the capital, with Islington being the highest, at £8,105 per pupil.
Specifically, it was those boroughs in Inner London which most commonly had a high level of spending, with Islington followed by the likes of Lewisham, Tower Hamlets, Camden, and Hackney, likely due to the higher salaries of teachers, but also due to increased social deprivation in these areas.
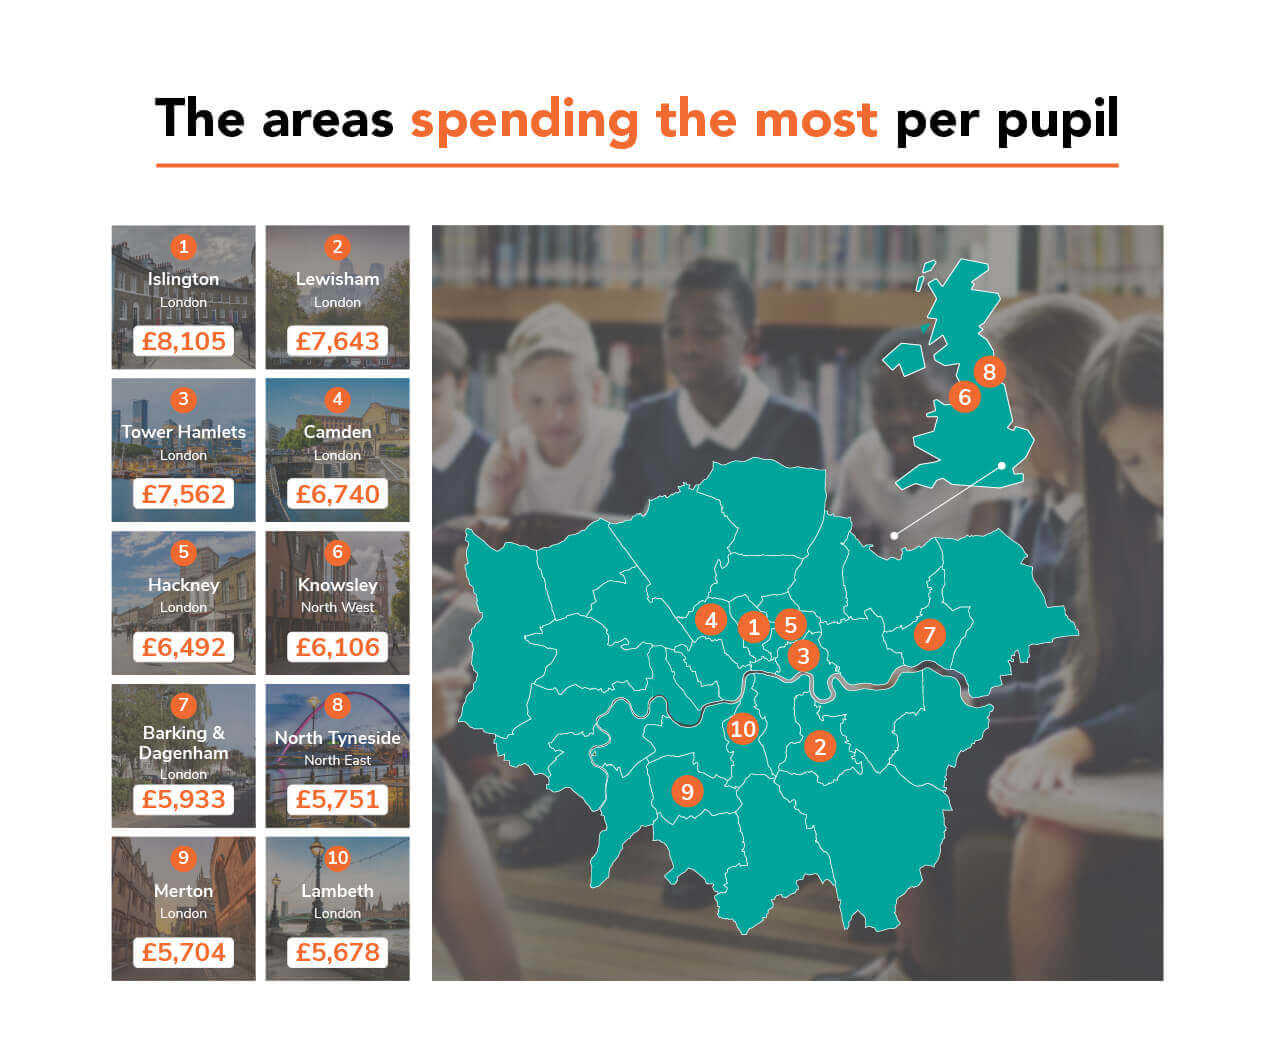
The only two areas from outside London in the top ten were Knowsley (£6,106 per pupil), on Merseyside, and North Tyneside (£5,751 per pupil), in the North East.
|
Rank |
Local authority | Region | Net education expenditure | Number of pupils | Net expenditure per pupil |
| 1 | Islington | London | £207,326,000 | 25,581 | £8,105 |
| 2 | Lewisham | London | £319,679,000 | 41,825 | £7,643 |
| 3 | Tower Hamlets | London | £363,955,000 | 48,127 | £7,562 |
| 4 | Camden | London | £218,195,000 | 32,371 | £6,740 |
| 5 | Hackney | London | £276,922,000 | 42,659 | £6,492 |
| 6 | Knowsley | North West | £126,748,000 | 20,757 | £6,106 |
| 7 | Barking & Dagenham | London | £264,106,000 | 44,517 | £5,933 |
| 8 | North Tyneside | North East | £179,805,000 | 31,264 | £5,751 |
| 9 | Merton | London | £188,987,000 | 33,133 | £5,704 |
| 10 | Lambeth | London | £227,356,000 | 40,043 | £5,678 |
The areas spending the least per pupil
Interestingly, despite previously highlighting that spending per pupil is much higher in London than in other parts of the country, two London boroughs fell into the ten areas with the lowest spend per pupil too: Bromley (£1,599 per person) and Bexley (£1,599 per person).
The area with the lowest spend was England’s smallest county, Rutland and while this can perhaps partially be attributed to the area’s very low population (just under 8,000 pupils, the third-lowest in the country), the county still comes bottom when we take pupil numbers into account as well.
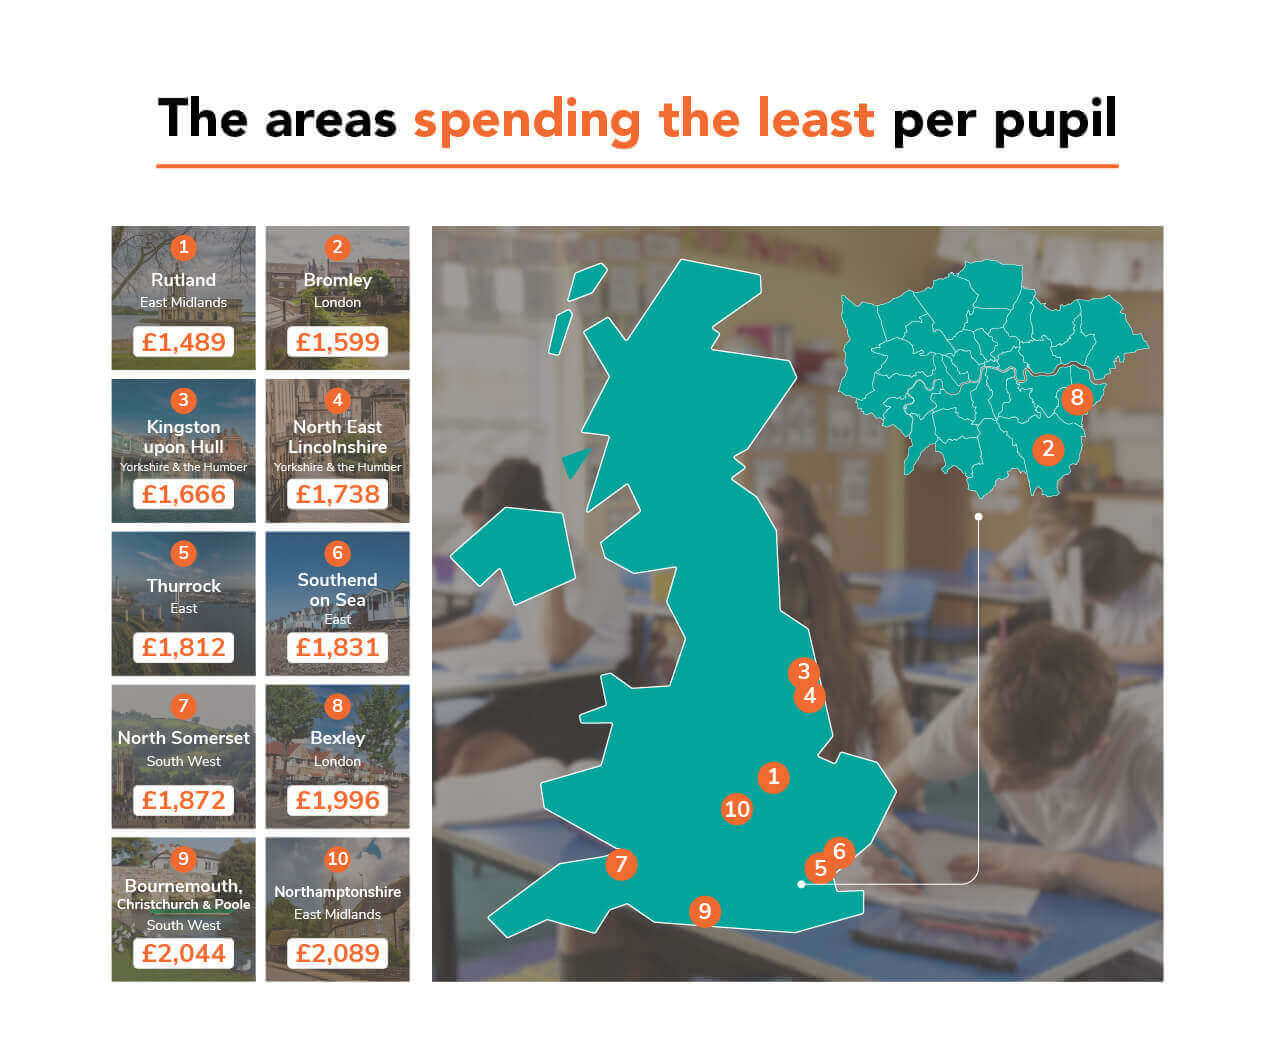
Other authorities that fall into the bottom ten are relatively spread around the country in areas such as Humberside (Kingston upon Hull and North East Lincolnshire), Essex (Thurrock and Southend-on-Sea), North Somerset, Bournemouth and Northamptonshire.
| Rank | Local authority | Region | Net education expenditure | Number of pupils | Net expenditure per pupil |
| 1 | Rutland | East Midlands | £11,881,000 | 7,980 | £1,489 |
| 2 | Bromley | London | £91,668,000 | 57,317 | £1,599 |
| 3 | Kingston upon Hull | Yorkshire & the Humber | £71,949,000 | 43,196 | £1,666 |
| 4 | North East Lincolnshire | Yorkshire & the Humber | £42,656,000 | 24,539 | £1,738 |
| 5 | Thurrock | East | £54,043,000 | 29,824 | £1,812 |
| 6 | Southend-on-Sea | East | £57,155,000 | 31,216 | £1,831 |
| 7 | North Somerset | South West | £59,726,000 | 31,909 | £1,872 |
| 8 | Bexley | London | £89,121,000 | 44,645 | £1,996 |
| 9 | Bournemouth, Christchurch and Poole | South West | £110,541,000 | 54,078 | £2,044 |
| 10 | Northamptonshire | East Midlands | £262,122,000 | 125,484 | £2,089 |
The areas where spending has increased the most
We also looked at how the total spending on education has changed over the last five years and again, it was London boroughs which came top of the tree.
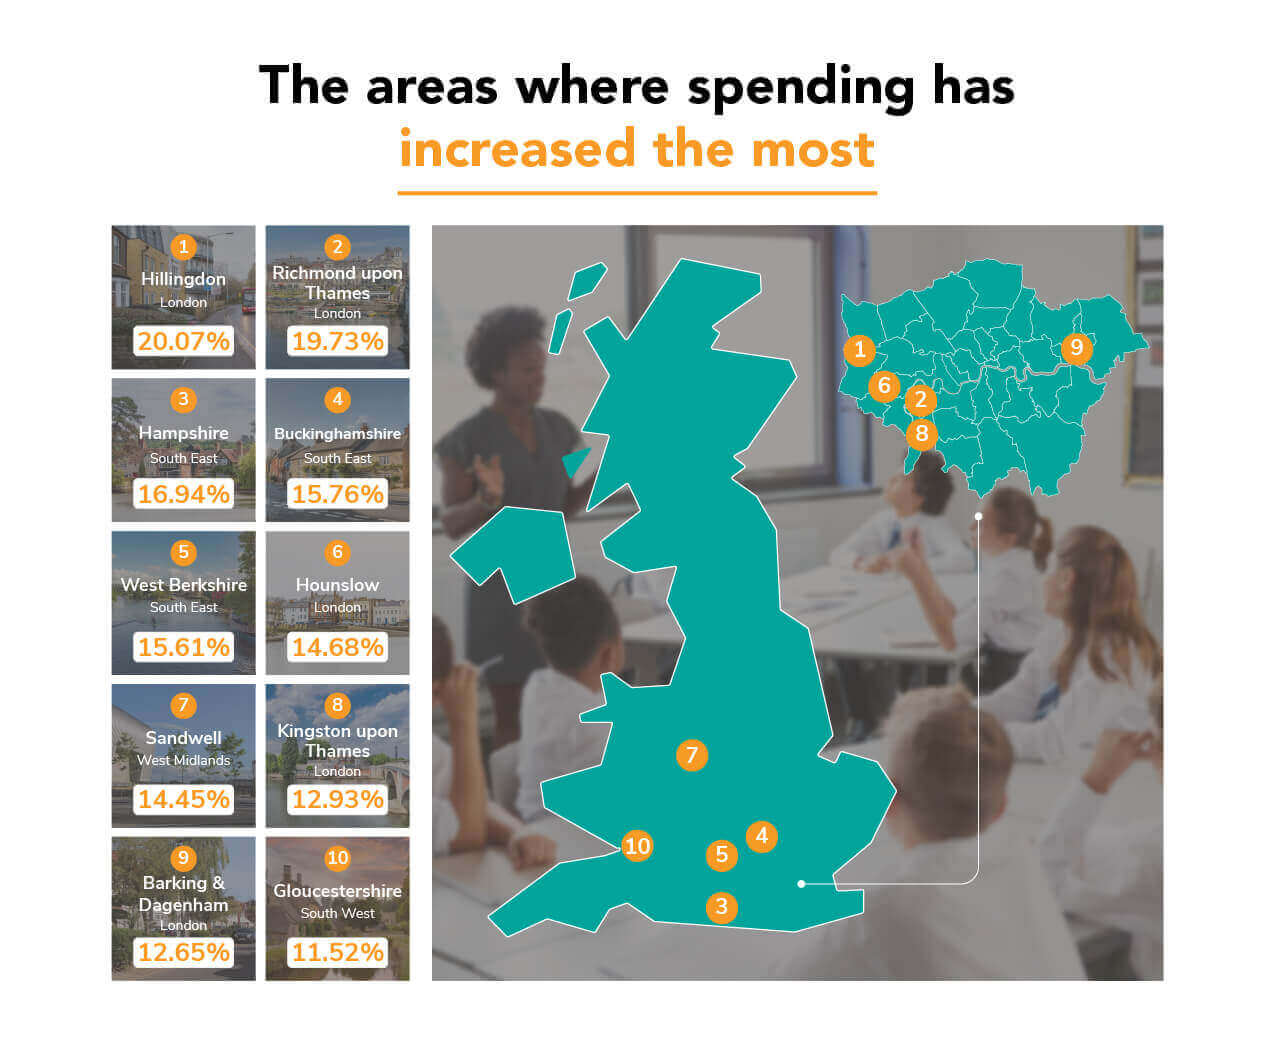
Five London boroughs fell in the top ten areas with the biggest spending increase, with Hillingdon increasing the most, from £162 million in 2014-15, to just under £195 million in 2019-29, an increase of 20%.
In fact, each of the top ten areas was found in the South, with the sole exception being Sandwell, in the West Midlands, which saw a five-year increase of 14.45%.
| Rank | Local authority | Region | 2014-15 net expenditure | 2019-20 net expenditure | Five-year change |
| 1 | Hillingdon | London | £162,093,000 | £194,627,000 | 20.07% |
| 2 | Richmond upon Thames | London | £115,362,000 | £138,123,000 | 19.73% |
| 3 | Hampshire | South East | £780,970,000 | £913,248,000 | 16.94% |
| 4 | Buckinghamshire | South East | £313,091,000 | £362,434,000 | 15.76% |
| 5 | West Berkshire | South East | £97,645,000 | £112,888,000 | 15.61% |
| 6 | Hounslow | London | £174,699,000 | £200,346,000 | 14.68% |
| 7 | Sandwell | West Midlands | £238,286,000 | £272,712,000 | 14.45% |
| 8 | Kingston upon Thames | London | £90,658,000 | £102,378,000 | 12.93% |
| 9 | Barking & Dagenham | London | £234,447,000 | £264,106,000 | 12.65% |
| 10 | Gloucestershire | South West | £286,468,000 | £319,470,000 | 11.52% |
The areas where spending has decreased the most
However, those areas where spending has increased are in the minority, with overall education expenditure falling in just under a third (63%) of local authorities.
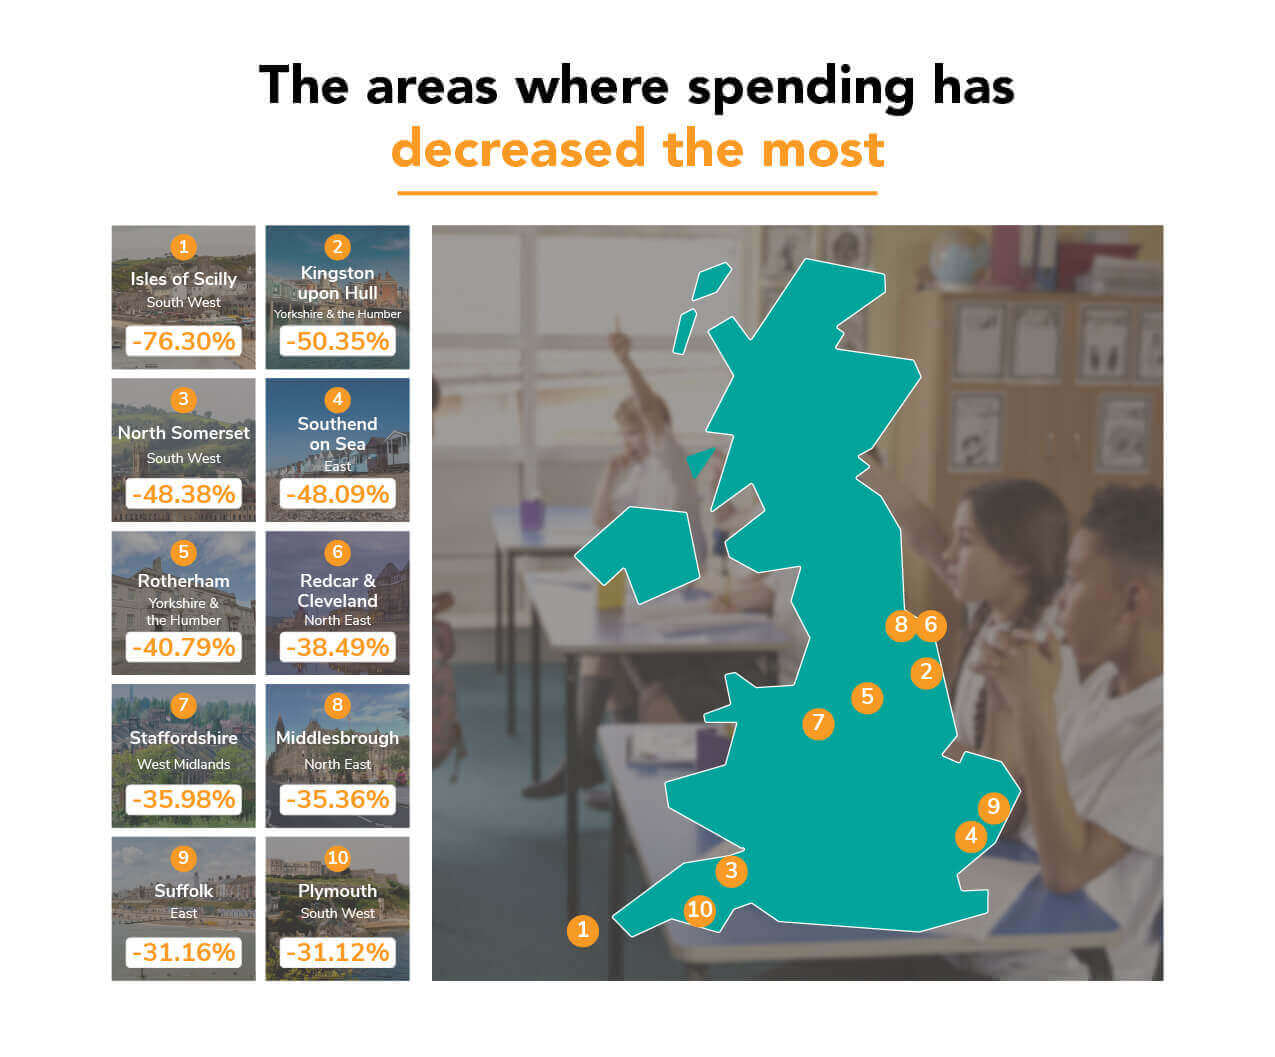
Aside from the Isles of Scilly, which are something of an outlier due to their very low population, the area where spending has decreased the most is Kingston upon Hull, which saw expenditure drop by half in the last five years.
For that reason, it’s perhaps no surprise that Hull and two other authorities in the bottom ten (North Somerset and Southend-on-Sea), also fell into the list of areas with the lowest spend per pupil.
| Rank | Local authority | Region | 2014-15 net expenditure | 2019-20 net expenditure | Five-year change |
| 1 | Isles of Scilly | South West | £3,772,000 | £894,000 | -76.30% |
| 2 | Kingston upon Hull | Yorkshire & the Humber | £144,916,000 | £71,949,000 | -50.35% |
| 3 | North Somerset | South West | £115,699,000 | £59,726,000 | -48.38% |
| 4 | Southend-on-Sea | East | £110,104,000 | £57,155,000 | -48.09% |
| 5 | Rotherham | Yorkshire & the Humber | £168,254,000 | £99,619,000 | -40.79% |
| 6 | Redcar & Cleveland | North East | £91,179,000 | £56,087,000 | -38.49% |
| 7 | Staffordshire | West Midlands | £531,183,000 | £340,058,000 | -35.98% |
| 8 | Middlesbrough | North East | £96,395,000 | £62,309,000 | -35.36% |
| 9 | Suffolk | East | £407,131,000 | £280,253,000 | -31.16% |
| 10 | Plymouth | South West | £124,712,000 | £85,897,000 | -31.12% |
Methodology
Education expenditure for 2014-15 and 2019-20 was sourced from the Ministry of Housing, Communities & Local Government’s local authority revenue expenditure and financing data collection.
The expenditure refers to the total net expenditure for early years education, primary schools, secondary schools, special schools and alternative education, post-16 education and other education and community budget. Note that due to changes in the structure of some local authorities in the last five years, some areas were omitted.
Pupil numbers were sourced from the Department for Education’s schools, pupils and their characteristics statistics 2019/20, and refer to the total number of pupils in all state-funded schools (aged 3-19).
Want to speak to someone about your EdTech spending?
Promethean is on hand to talk to you about your EdTech choices for interactive displays, teaching software and a full professional development support plan. Ready to talk more right now? Why not request a virtual demo with one of our friendly education team members?